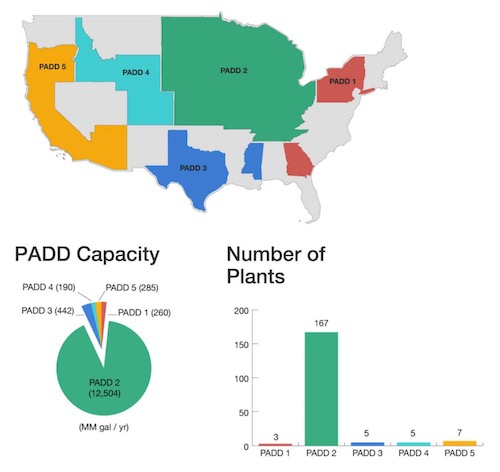
These are a series of static info-graphics created to show the production capacity at various regions throughout the country involved in the production of ethanol.
Graphics were developed using Adobe Illustrator and the interactive table is built using JQuery DataTables. The page is hosted on GitHub.com.
It is available here.